
Case Study: Inventory Dashboard in Power BI
Client Overview
A local retail chain selling apparel.
Problem
The client explained that they felt they were losing money on inventory every year. They would overbuy, and then when they needed to make space, sell product as a steep discount, often at a loss. This client had the infrastructure to transfer inventory between stores instead of buying new inventory when a particular store was running out. However, their POS system did not offer a proper interface or the proper metrics for:
- Determining when inventory was truly getting too low at a given store for a given product
- Alerting them which other stores had that product available for transfer.
Solution
For this client, Boxplot created an entire sales and inventory data management system, including:
Automatic Data Flow
We set up a PostgreSQL database and wrote a Python script that automatically extracted data every day from the POS system and added it to the database.
Dashboards for Decision-Making
We connected the SQL database to Power BI and created dashboards based on the data. The dashboards answered those crucial questions the company had – which merchandise can be transferred? When does it make sense to buy more of a particular product? What are our top products for this week? The PowerBI dashboards also automatically refresh so that users at the company are getting the most up to date information every time they login.
Calculated Savings
-14.37%
Cost/Revenue YTD – PYTD
How much less have they spent as a percentage of revenue this year (YTD) compared to last year(PYD)?
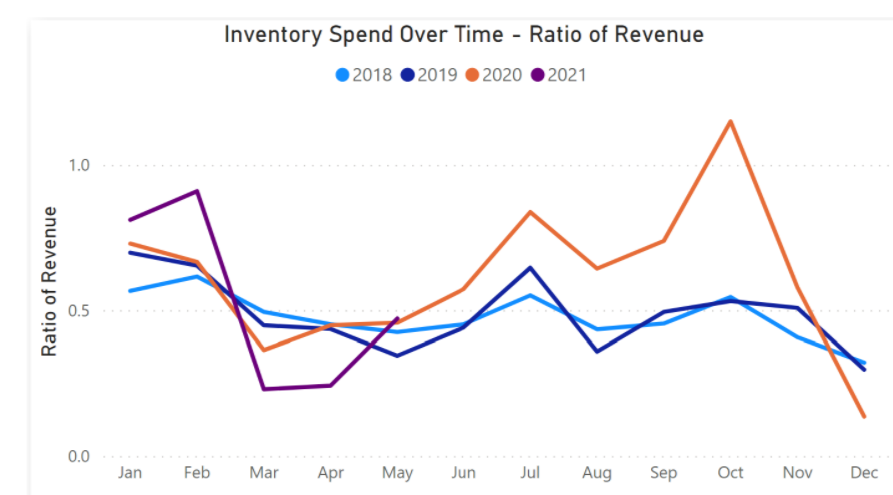
YTD they have spent 43.59% of revenue on inventory vs. PYTD they spent 57.96% of revenue on inventory. They have spent 14.37% less this year as a percentage of revenue.
(Ratio of Revenue = $ cost of inventory / $ total revenue)
-32.54%
Ratio of Products YTD – PYTD
How much less have they spent as a percentage of # of products sold this year (YTD) compared to last year (PYD)?
YTD the ratio of products sold is 26.68 vs 39.55 for PYTD, which is 32.54% difference. This means that they are selling 32.54% more products for every dollar spent of inventory.
(Ratio of products = $ cost of inventory / # of products sold)
The Dashboards
For client privacy, all data have been anonymized. All models and vendors are fake.
Both dashboards have filtering and slicing capabilities. There are complicated DAX formulas and custom M Code underlying these dashboards.
Live demos below- Try them out!
- Use the sliders and dropdowns to interactively filter and drill down into the data
- Use arrow keys (at bottom of display) to change page
Owner Dashboard
The first dashboard was created for the owners of the company so they could keep tabs on important KPIs for all of their stores:
Use arrow keys to change page
Please try the demo dashboard on a desktop computer.
Manager Dashboards
We also made a dashboard for the manager of each of their stores. It shows only that store’s data and metrics relevant to the managers.
Use arrow keys to change page
Please try the demo dashboard on a desktop computer.