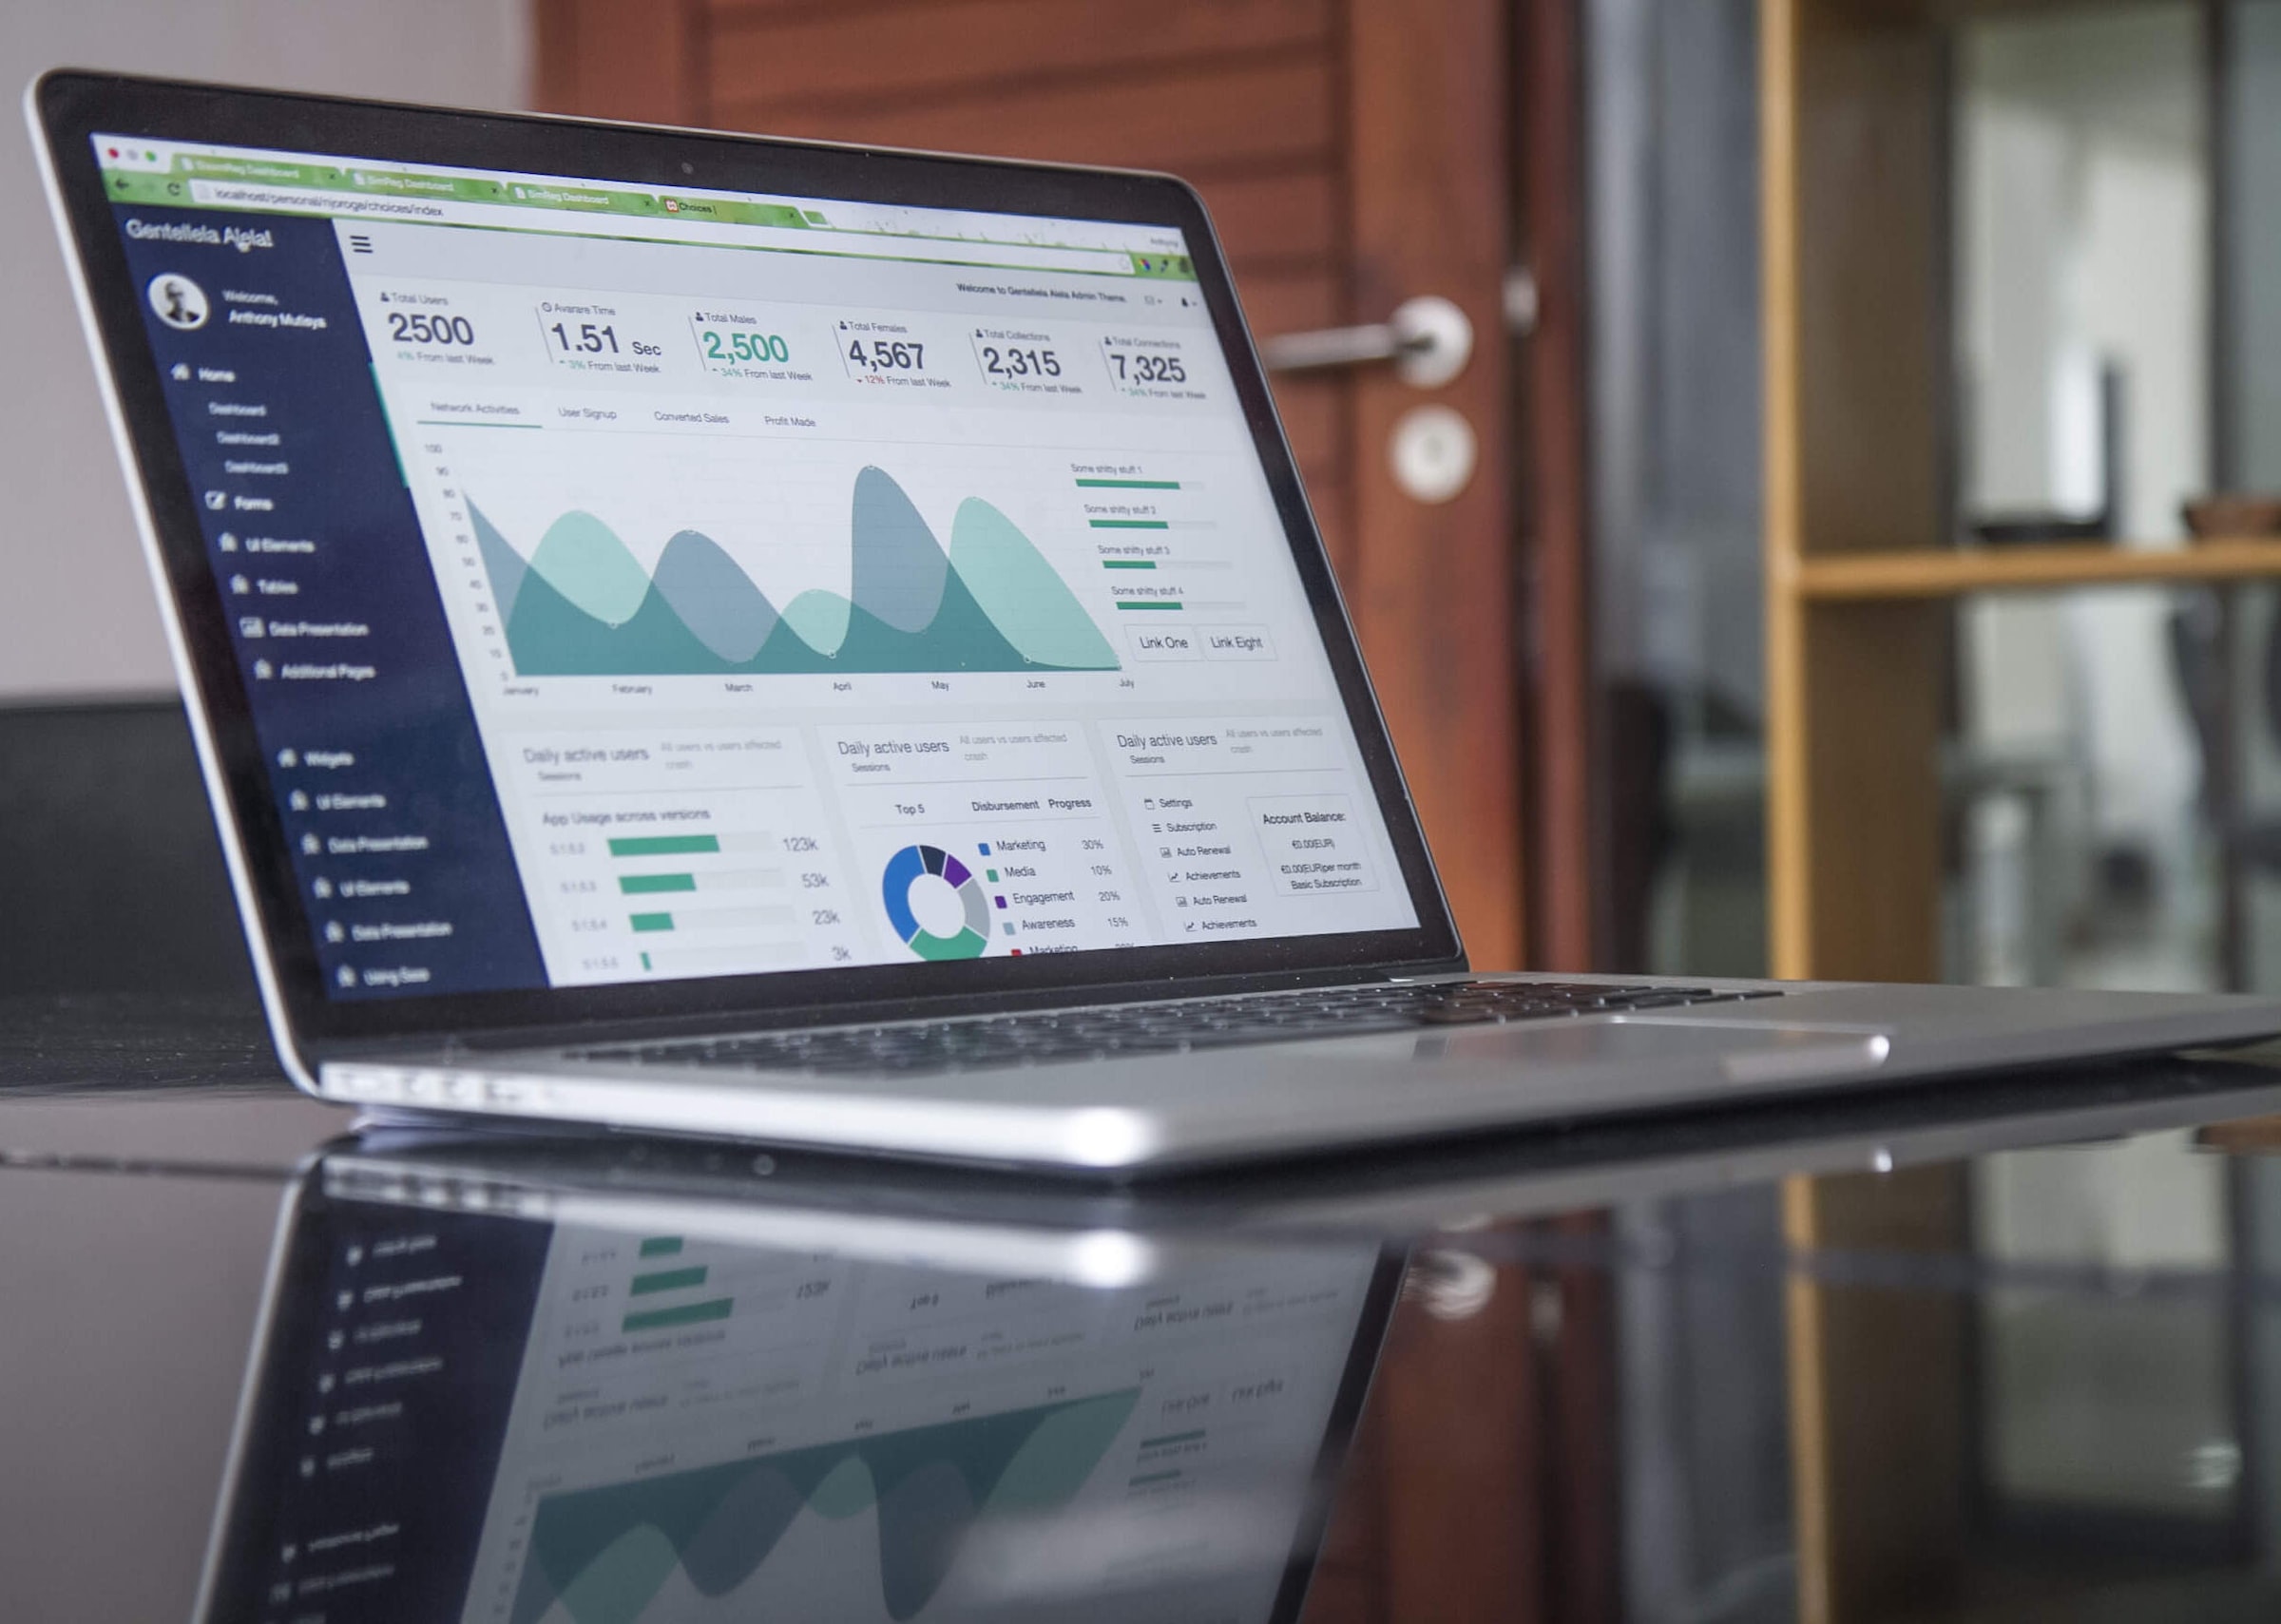
Sales and Inventory
Sales and inventory have always been among the most quantitatively-heavy components of a business, which means they have a lot to gain from a sturdy data strategy. These gains can come in the form of advanced predictive and diagnostic insight generation, or just a simple improvement in the way your organization stores its data; there truly is something for everyone to gain, regardless of your prior level of data-oriented experience. This article gives you some ideas for how to get the most out of your organization’s sales and inventory data.

Photo by Clay Banks on Unsplash
Sales and Inventory Data Management
Any competent data strategy starts with astute data storage. Here are scenarios you typically want to avoid, especially if you are a growing organization:
- Entering sales and/or inventory data into Excel by hand
- Exporting data from a sales system into too many Excel sheets
- Relying on data from your POS or other system as it is stored or presented
As an example, imagine you are organizing your data in a disconnected Excel sheet, and a certain datapoint on one of those Excel sheets is being used on 25 different sales reports across your organization. Now imagine you notice that you entered that datapoint incorrectly; the only way to solve this issue is to painstakingly go through all 25 reports by hand and correct it. But if you had used automated centralized storage instead, updating just one value in the central location would correct that value on all 25 reports at once. This is a common benefit for reports that have to be updated on a set schedule (e.g., a weekly sales or inventory report); instead of having to update the reports by hand every week, tying the reports to a centralized database allows them to be fully updated at the click of a button.
And there are other benefits of automated data storage in addition to convenience; organizing your data in a centralized database—which is almost always how automated data storage works― allows everyone who uses the data to access a single source of truth.
 Image by storyset on Freepik
Business Intelligence Dashboards and Report
Business Intelligence (“BI” for short) refers to the technical process of collecting, storing, and analyzing the data that a business produces. This process usually involves the configuration of dynamic dashboards and reports that display information to answer relevant business questions concisely. In nearly all fields, from marketing to HR to telecom to finance, even the most non-technical professionals are beginning to leverage BI to drive value for their businesses, and this trend extends quite well to the sales space. There are several key components of competent BI practices:
Metrics

Knowing which metrics to track is half the battle when it comes to BI. A marketing team may track click-through rates on their social media advertising to understand which advertisements are generating the most user interest; an HR analytics team may track turnover rates to gain insights on employee retention. Both of these are examples of BI analytics that a business may use. And when it comes to sales and inventory, popular metrics include number of units sold, revenue, same store sales, inventory counts, inventory turnover, and so on. What really matters when selecting which metrics to track is to be answering the question(s) that your business wants answered; does your list of chosen metrics deliver you the insights that your business is looking to generate? If the answer to this question is yes, you are well on your way to a strong BI practice.
Domain Knowledge

As a sales/inventory professional, you are in a unique position to know exactly which pieces of sales-related information are relevant to your business needs. Therefore, you know better than anyone what would add value to put on a sales BI dashboard versus what would not. Data analysts refer to this know-how as domain knowledge. This sort of know-how was a massive advantage in the Boxplot client project explored in this case study; the client’s domain knowledge helped us understand that inventory was the main area on which the analysis should focus, as opposed to revenue, contracts won, or other areas of sales.
Software

 We are Tableau Desktop Certified
There are many options when it comes to which software to utilize for your organization’s BI, but the most popular choices would be Excel, PowerBI, and Tableau. Each of these three platforms has a massive user base and support community. While Excel certainly has the largest following of the three options across almost any industry, Boxplot’s recommendation is to prefer PowerBI or Tableau, especially if your goal is to have your dashboards and other analytics update on a hands-free basis; the world’s leading BI specialists tend to prefer PowerBI and Tableau because of the visualization and real-time analytics options that each one has which are not available in Excel.
Machine Learning: Sales Prediction

Photo by Markus Spiske on Unsplash
Trying to predict sales ―or any real-world outcome, for that matter― based on gut feeling alone has its flaws. This is primarily because humans are subject to biases towards their own experiences; taking a data-oriented approach, however, will ensure that we are evaluating a globally-representative sample of information. Data scientists employ a type of computer programming called machine learning to make this sort of data-driven prediction. Machine learning refers to the process of teaching a computer how to identify and extrapolate upon patterns in data, as opposed to a human completing these tasks. In this case, a data scientist can use a large quantity of historical sales data to make a prediction of future sales for the short, medium, and long term.
There are several algorithmic methods that data scientists use to predict sales.
The first method, with which you may already be familiar, is regression analysis. Regression analysis determines the statistical relationship between sales (or some other target variable that you are trying to predict) and any number of other factors; if you understand these relationships, information about the other factors will help you predict the sales. As I will explain later, an added benefit of regression analysis is that it also provides diagnostic insights.
The second method is time-series forecasting. Time-series forecasting is similar to regression analysis, except instead of using external factors to predict the target variable, you use patterns in the historical data of the target variable itself to predict future data of the target variable. An advantage of this method is that it can recognize complex patterns such as seasonality, volatility, inflection, and others, which are usually missed by regressions; the downside is that time-series forecasting doesn’t provide any diagnostic insights.
The third method involves a special machine-learning model called a neural network. Neural networks learn patterns in data by mimicking the anatomical process by which your brain learns information. Specifically, a neural network consists of a series of “neurons” which each contain information about how to predict a particular outcome. As data is then read by each neuron, the neuron sends its best guess about the future outcome to the next neuron in succession, until the final neuron makes the final decision as to its prediction. The final neuron can then let previous neurons know whether they got the prediction correct in a causal tracing pattern known as backpropagation.
Machine Learning: Sales Diagnostics

Photo by Carlos Muza on Unsplash
In addition to predictive analytics, there are other machine learning algorithms that focus on diagnostics; in other words, when customer demand changes, such algorithms can determine the probable causes of the shift.
Algorithmic methods for diagnostics usually focus on regression analysis. As with predictive analytics, these machine learning-driven diagnostic models tend to be more reliable than gut-feeling analytics due to a reduction in bias.
Customer Churn Prediction
So you’ve started sourcing new clients using data analytics. Now comes the next challenge: how can you retain as many of our current clients as possible? Once again, the answer lies in your data; implementing an effective machine learning algorithm or general data analysis will allow you to identify which clients are at risk of terminating their contracts, a month, a quarter, or even a year ahead of time. This will allow you to shift your intervention measures from reactive to proactive, in a way that none of your competitors can match.

Your Organization’s Data Strategy
If you are feeling daunted by the prospect of improving your organization’s data strategy on your own, there’s no need; Boxplot has helped numerous clients just like you realize their data-driven goals. And even if you feel comfortable undertaking this work on your own, our line is always open to give you some fresh ideas. Either way, get in touch with us here ― you’ll be glad you did.
 We are Tableau Desktop Certified


