Small Business Social Media Metrics
Small Business Social Media Metrics
by Boxplot Apr 23, 2023

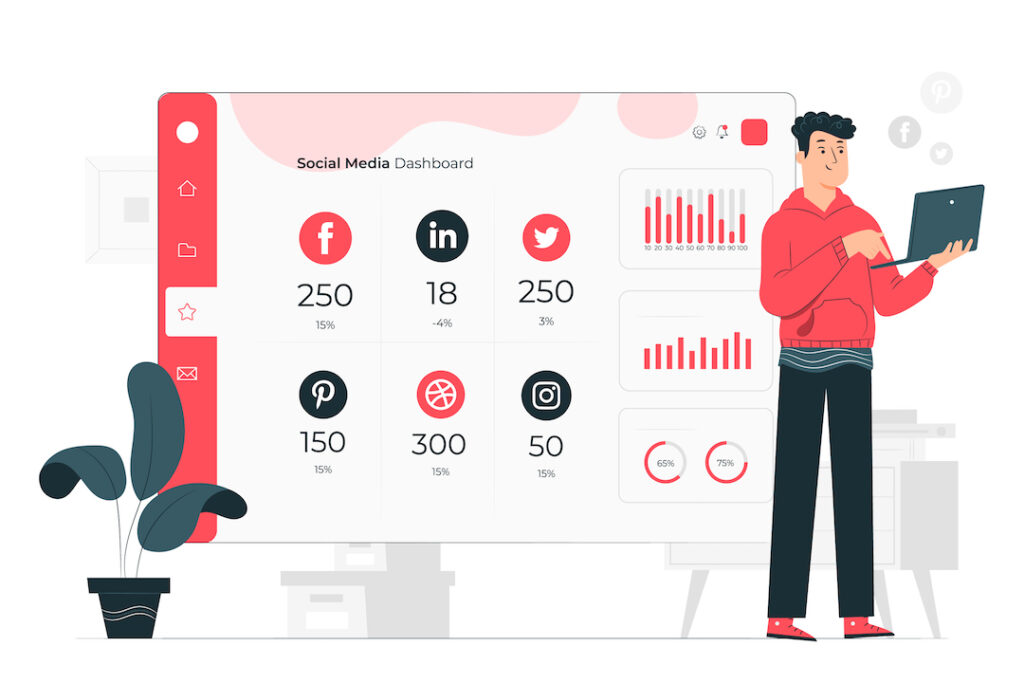
A superior social media analytics practice is one of the best ways for small businesses to gain an edge over larger competitors. And the growing accessibility of advanced analytical tools makes social media analytics a worthwhile pursuit even if on a tight budget. This blog post covers some of the most useful social media-specific metrics ―which cover topics including audience/demographics, brand ecosystem, and engagement/conversion― to help organizations like yours get started with social media analytics. Check out our social media presentation blog post here.
Audience & Demographics
These metrics involve analyzing those who interact with your social media content rather than analyzing the social media content itself.
- Age Distribution. Do your social media pages attract older or younger audiences? Knowing the ages of who is interacting with your social media pages, such as the average and median age of those who “like” your posts, can help with everything from content selection to product pricing strategies.
- Geographical Distribution. How global is your organization’s reach on social media? Analyzing social media data by geography, such as viewing the number of followers on your Instagram page broken down by country, is one of the best ways to understand your existing and prospective customers. Knowing the geographical distribution of your audience may also assist with knowing when to post; the goal there being to post content to align with the time of day that people in each time zone are likely to be on social media.
- Gender. What is the distribution of your audience among different genders? How does that differ in terms of who views your posts versus who “likes” your posts?
- Ethnic Background. Similar to other demographic information, understanding how audiences of different ethnic backgrounds interact with your social media content allows you to infer a lot of insights that can help optimize your organization’s strategy.
Engagement & Conversion
These metrics involve analyzing data about the pages and posts themselves that your organization is creating via social media.
- Click-Through Rate. Out of all visitors to your social media pages, what proportion click on links that appear there? This is what click-through rate (CTR) measures. A higher CTR means that your audience is well-engaged with the content that you post.
- Clicks. Exactly what it sounds like: how many times has your audience clicked on content that you post on your social media pages? This metric can be measured on an overall basis or for individual posts.
- Impressions. Impressions count the number of times one of your pages is shown to someone.
- Pageviews. Pageviews count the number of times an audience member views one of your pages. This metric differs from impressions in that it counts views rather than actions. In other words, if someone views your page three times, that would count as three impressions but only one pageview.
- Shares/Retweets. Again, this metric can be calculated on an overall or post-by-post basis.
- Subscriptions. How many audience members have subscribed to your communications via social media, such as subscribing to your YouTube channel or to a monthly mailing list?
- Comments
Brand Ecosystem
These metrics concern trends occurring in the industry in which your organization operates. One key difference between this group of metrics and the others covered in this article is that these metrics analyze data originating from external social media pages rather than your organization’s.
- Industry Trends. There are many separate metrics within this category. For example, what has been the most talked about new product on social media over the past six months in the industry in which your organization operates?
- Comparative Pricing. How are your competitors’ audiences reacting to their prices on social media? What percent of reactions in the comments are positive versus negative? Knowing this information can help your organization optimize pricing strategies to win over potential buyers from competitors, and it is all accessible by analyzing social media data.
None of these lists are exhaustive either! If you’re a very small business that doesn’t have a lot of time to dedicate to this, but wants to get started understanding your social media performance, we recommend our sister company Pulse Metrics. Their app will deliver insights like “Your average number of likes is down by 20% this month” or “Did you know that most of your audience is female between the ages of 18 and 24?” right to your email inbox. No need to learn how to make dashboards, or spend any time configuring settings. Connect your social media platforms in a few clicks and the app automatically starts generating insights.
If you are a larger business and need more custom analyses to reach your analytical goals through social media data, a bespoke selection of metrics to focus on is almost always the most successful. As always, Boxplot is happy to discuss your strategy when it comes to social media analytics, regardless of your prior level of experience with it.
<< Previous Post
"Line Graphs"
Next Post >>
"Excel Templates for Data Analysis"


