Qlik Ticketing App
This client project involved creating a Power BI dashboard from several source including Salesforce data and internal Excel/CSV files. This project was for a company in the pharmaceutical industry, and displayed ticketing-related data. The dashboard features a homepage that offers navigation for the other pages. The other pages include:
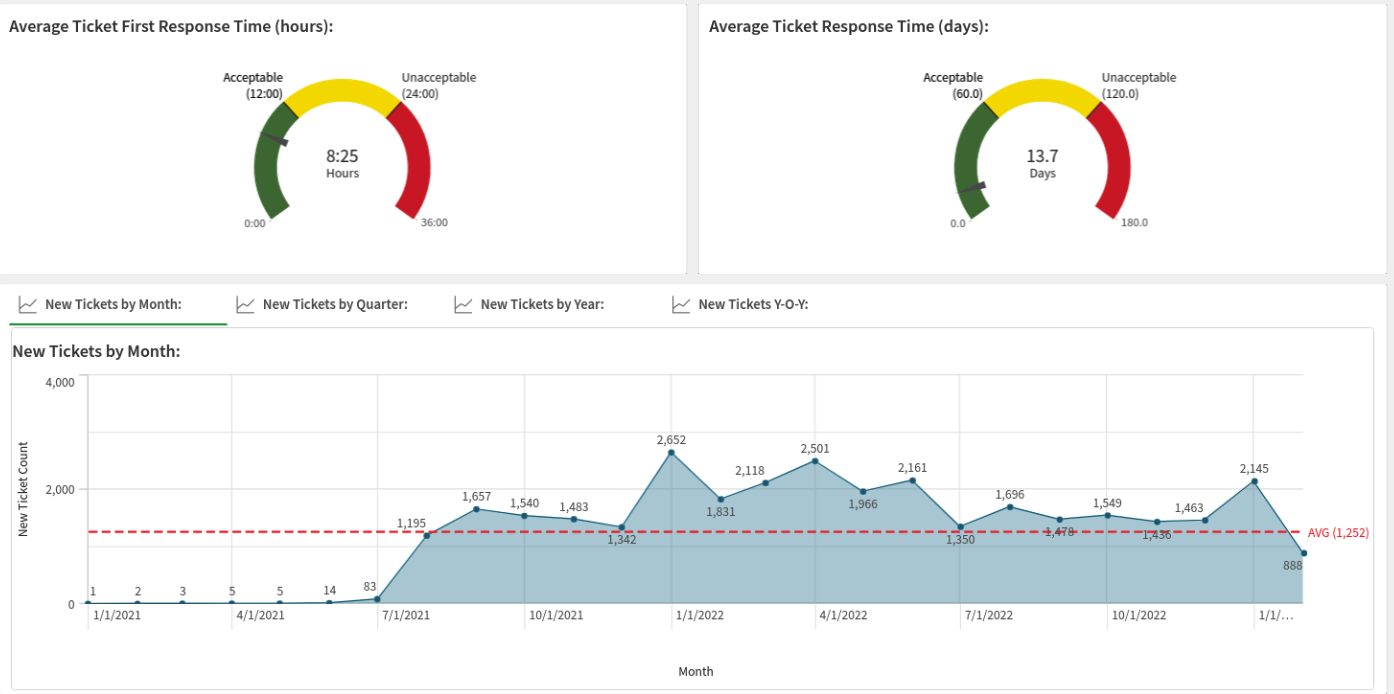
Executive Dashboard
A high level overview of key metrics for management.
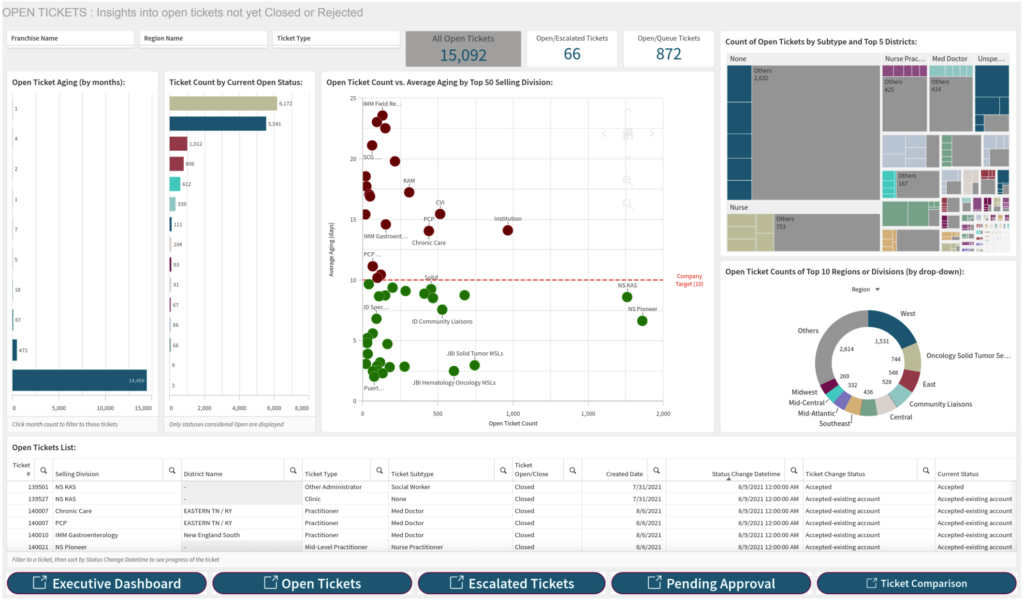
Open Tickets
A deep dive into what types of tickets are open, how long they’ve been open, and which tickets need the most urgent attention based on goals/KPIs.
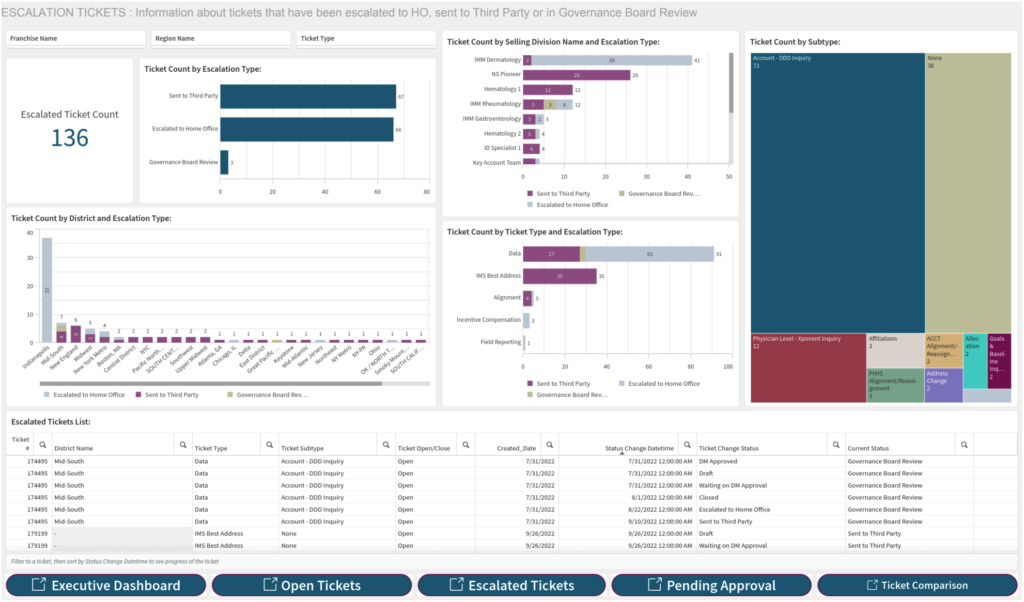
Escalated Tickets
Detailed information about which tickets were escalated, key words within escalated tickets, and the types of tickets being escalated.
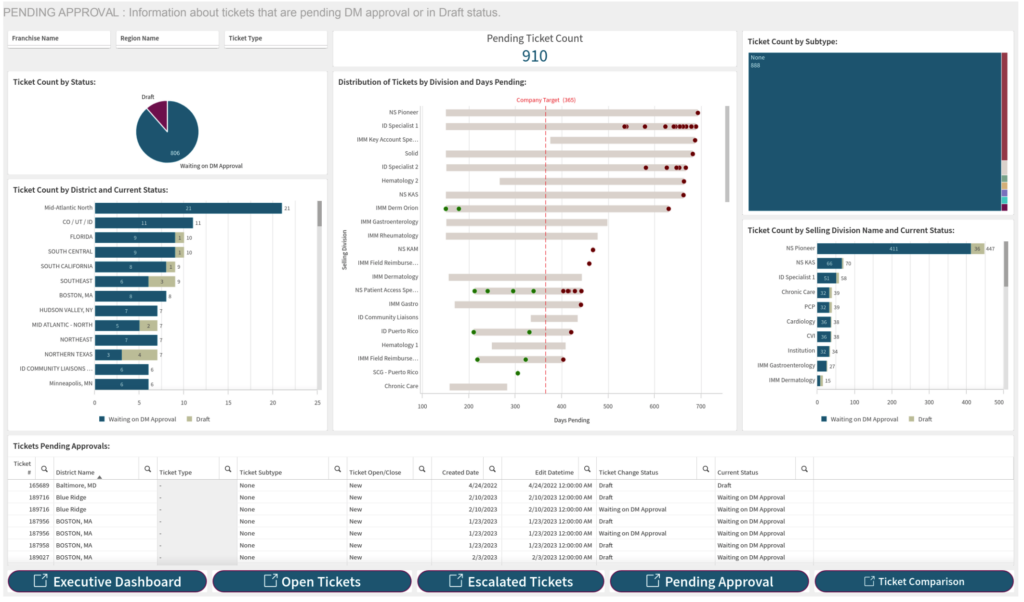
Pending Approval
Similar to the Escalated Tickets dashboard, key metrics about tickets that are pending manager approval.
Comparison Report
This dashboard allows the user to pick any two custom timeframes to compare them. For example, say the user wanted to understand how their team’s performance in resolving tickets compared this week last year to this week this year. They could adjust the sliders and see key metrics about those two time periods side by side.
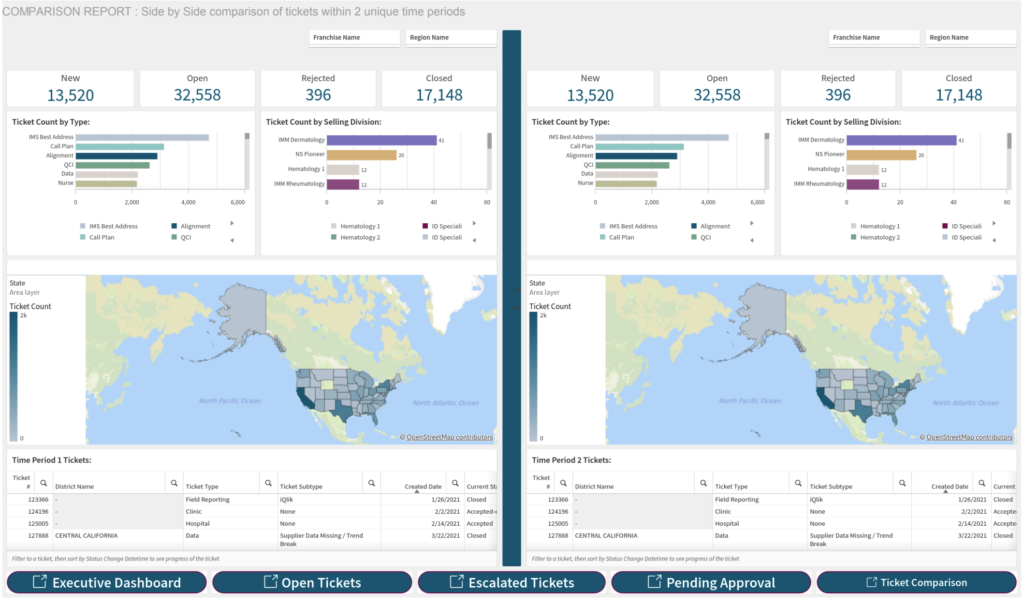
All data has been anonymized, and references to the company have been removed.


