Regression Analysis for EdTech Firm
Client Profile
The client was an edtech startup firm that offers standards-aligned curriculum through an article-based engagement format. They offer both free and payware versions. The overarching goal of their data strategy is to drive higher student and teacher usage of the product through targeted product enhancements; the firm uses advanced analytics to determine where to target such efforts. For this project, the client was interested in determining what would maximize an internal metric called the AB Score. AB Score measures the likelihood that a customer renews their product license. Of course, it was in our client’s interest to maximize the likelihood that a customer keeps using the product, and thus it was extremely valuable for our client to determine which engagement metrics were associated with a higher AB Score.
Solution
We employed Elastic Net regression for this project, with AB Score as the dependent variable and 39 specific engagement metrics provided by the client as the regressors. Regression analysis was preferable to other categories of Machine Learning algorithms because (a) AB Score is a continuous variable while other ML algorithms are designed to have a categorical attribute as their dependent variable, and (b) regression output would allow us to interpret the results and perform diagnostic analysis; this was more the client’s goal than predictive analysis of the AB Score (Neural Networks, SVM, and other ML algorithms are better suited for predictive analytics than diagnostic analytics). We specifically chose Elastic Net to reduce the long list of explanatory factors that our client asked for us to look into a more manageable and actionable list. Elastic Net would also give us a set of regression coefficients as output that could be used to interpret the relative importance of each regressor.
Elastic Net Regression: What Is It?
Elastic Net Regression is a generalized form of Shrinkage Regression, which seeks to remove irrelevant variables from the regression model alongside estimating regression coefficients. In other words, while using conventional regression analysis requires feature selection and coefficient estimation to be performed in separate, disconnected processes, Shrinkage Regression performs both of these processes together. There are two basic kinds of Shrinkage Regression: LASSO and Ridge. LASSO chooses regression coefficients βLASSO by minimizing residual sum of squares (RSS) subject to an absolute-value constraint called a “penalty term”. As seen in the diagram on the bottom-left, imposing this penalty term increases the RSS of the regression, but it also removes certain regressors from the model by setting βLASSO = 0 if the relevancy of the regressor is not high enough. Ridge performs a similar process but uses squared-value penalty terms instead of absolute-value penalty terms. You may hear the usage of absolute-value penalty terms and squared-value penalty terms referred to as L1 Regularization and L2 Regularization, respectively.
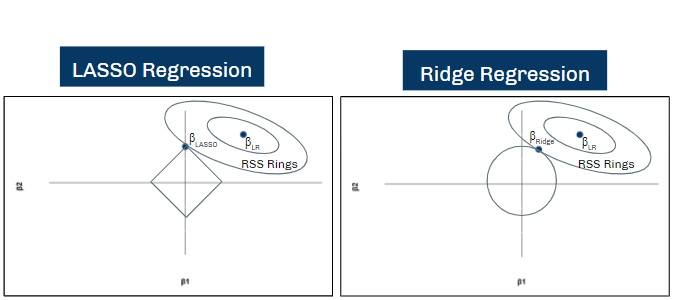
Elastic Net applies both L1 and L2 regularization simultaneously, allowing the algorithm to determine whether the optimal model is closer to a LASSO regression or a Ridge Regression.
Points Of Note Regarding Solution
Avoidance of Multicollinearity
Multicollinearity describes an interpretational problem that arises when multiple features (regressor variables) are highly correlated. When this happens, the algorithm has trouble determining how much variability can be attributed to each feature in a set of highly-correlated features. Elastic Net deals with this threat by removing all but one variable in each set of highly-correlated variables automatically, further supporting our opinion that Elastic Net is the proper algorithm to use for this project.Avoidance of Overfitting
The risk of overfitting is a large concern when conducting any kind of regression analysis. This is especially true in the case of this project because there are so many features. Since regressions can contain any number of features, it would therefore be tempting for a naïve data scientist to simply include all variables in a regular OLS regression to ensure that all variables of interest are considered. But the more variables that are included in a regression, the greater the risk of overfitting. This fact presents another reason why Elastic Net regression is the proper algorithm to use in this case – Elastic Net removes irrelevant variables from the model altogether, thereby reducing the number of variables ―and hence the risk of overfitting― from the model.
We also utilized cross validation to double-check that overfitting was not interfering with our model. If overfitting were occurring, it would mean that the model is “memorizing” specific data points in the training set rather than generalizing well to the overall population; in technical terms, if the model were predicting outcomes of the training set much better than outcomes of the testing set, that would be an indication that the model is overfit. Cross validation ensures that this pattern does not appear. By generating an R2 value of prediction on both the training set and testing set and seeing that the two are roughly equal (it turned out to be 0.339 on the testing set versus 0.352 on the training set), we can conclude that the model is generalizing quite well for previously-unseen data.
Conclusion
The model determined that the number of “premium” actions taken by users, specifically purchasing the ELA-oriented version of the product, whether the school had previously renewed their product license, and the “tier” to which the school had belonged (an internal metric that our client used to profile schools), were all strongly linked with AB Score, indicating that targeting the associated areas of the product is likely to cause a significant increase to the AB Score. Furthermore, it was determined that the salesperson who had sold the product license to the district seemed to have an effect on AB Score, though we left it up to our client’s discretion whether this should be an action item for them or not.
R2 did turn out to be on the lower side. The R2 of 0.339 on the testing set means that the variables we looked at account for approximately 33.9% of the variation of AB Score. This finding does not mean that there was anything wrong with our model; it simply indicates that there are many other factors outside of the engagement metrics that this project covered that affect a school district’s likelihood to renew their product license. In and of itself, that information was also a valuable insight to our client.
Bespoke Solutions For Your Organization
Boxplot Analytics is passionate about working with all clients, regardless of their previous level of experience in data. If your organization is looking for a solution similar to the one described in this article ―or any other data-oriented capability― let us know by contacting us here.