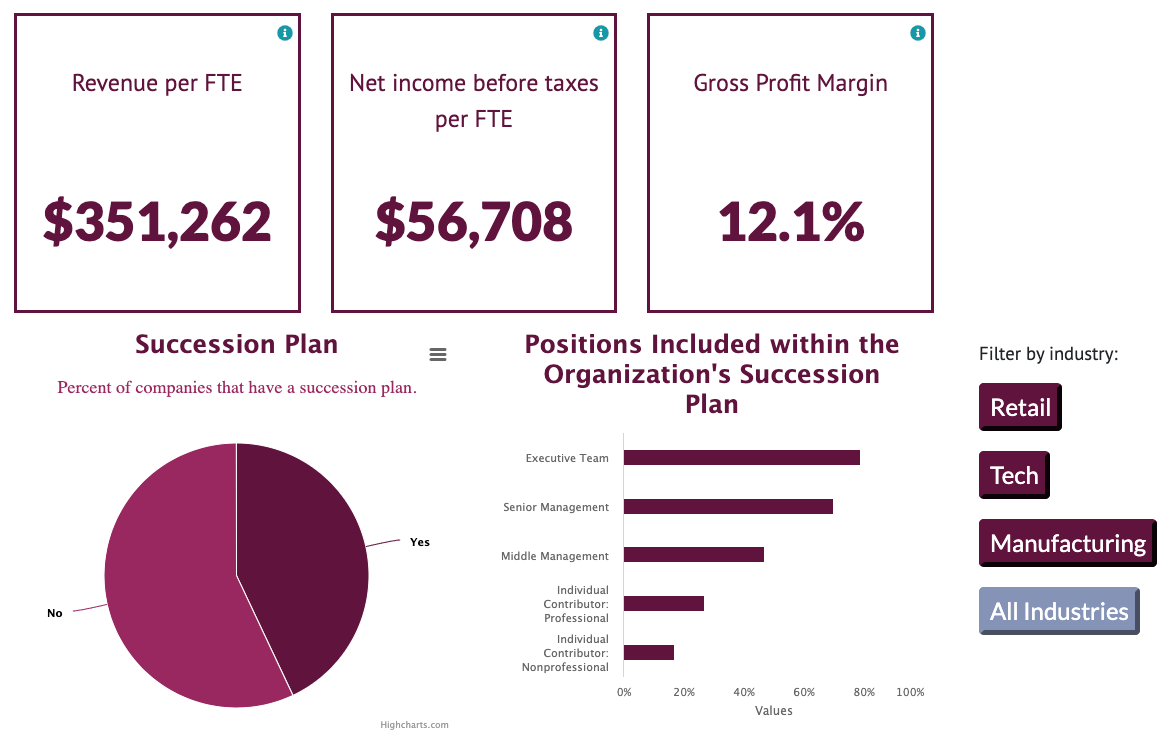
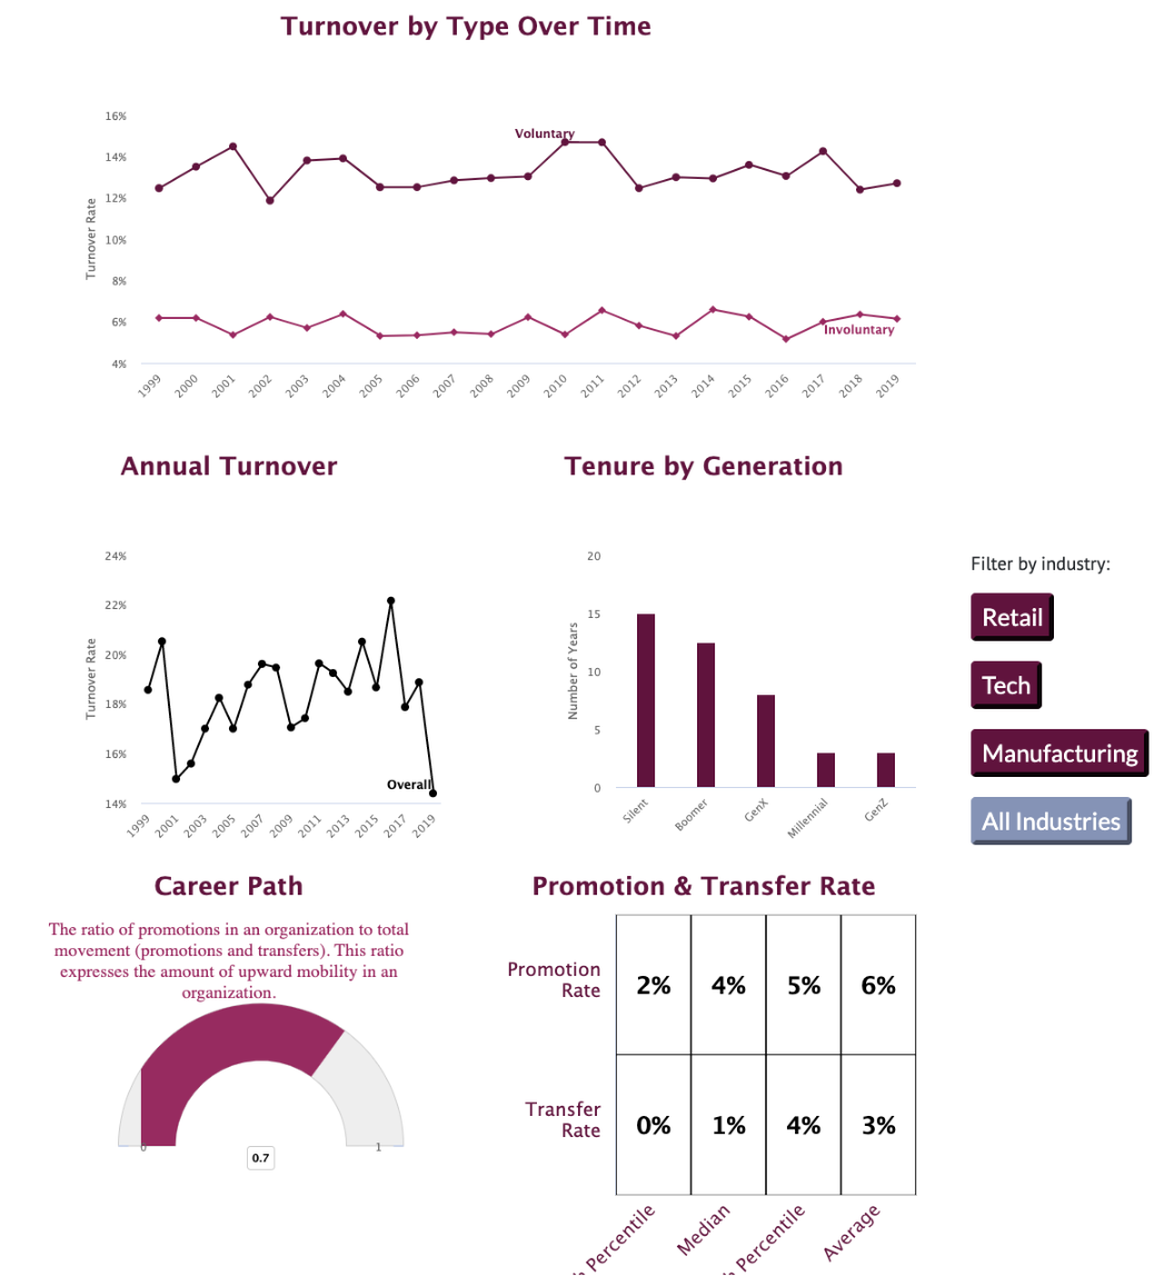
This is a dashboard we completed for a startup tech client who needed to effectively display a variety of Human Resources metrics. The dashboard is custom coded using JavaScript, Python, and HighCharts. JavaScript is an excellent way to embed beautiful and responsive data visualizations into webpages like you see here. The dashboard is fully responsive (viewable on any device, anywhere in the world) and even has slicer functionality. The top chart intentionally does not change. However, the entire rest of the dashboard will change based on which industry button on the right-hand side is selected. These types of dashboards are fully customizable – they can be longer, shorter, or split among multiple pages. The colors, buttons, and fonts are all customizable as well.