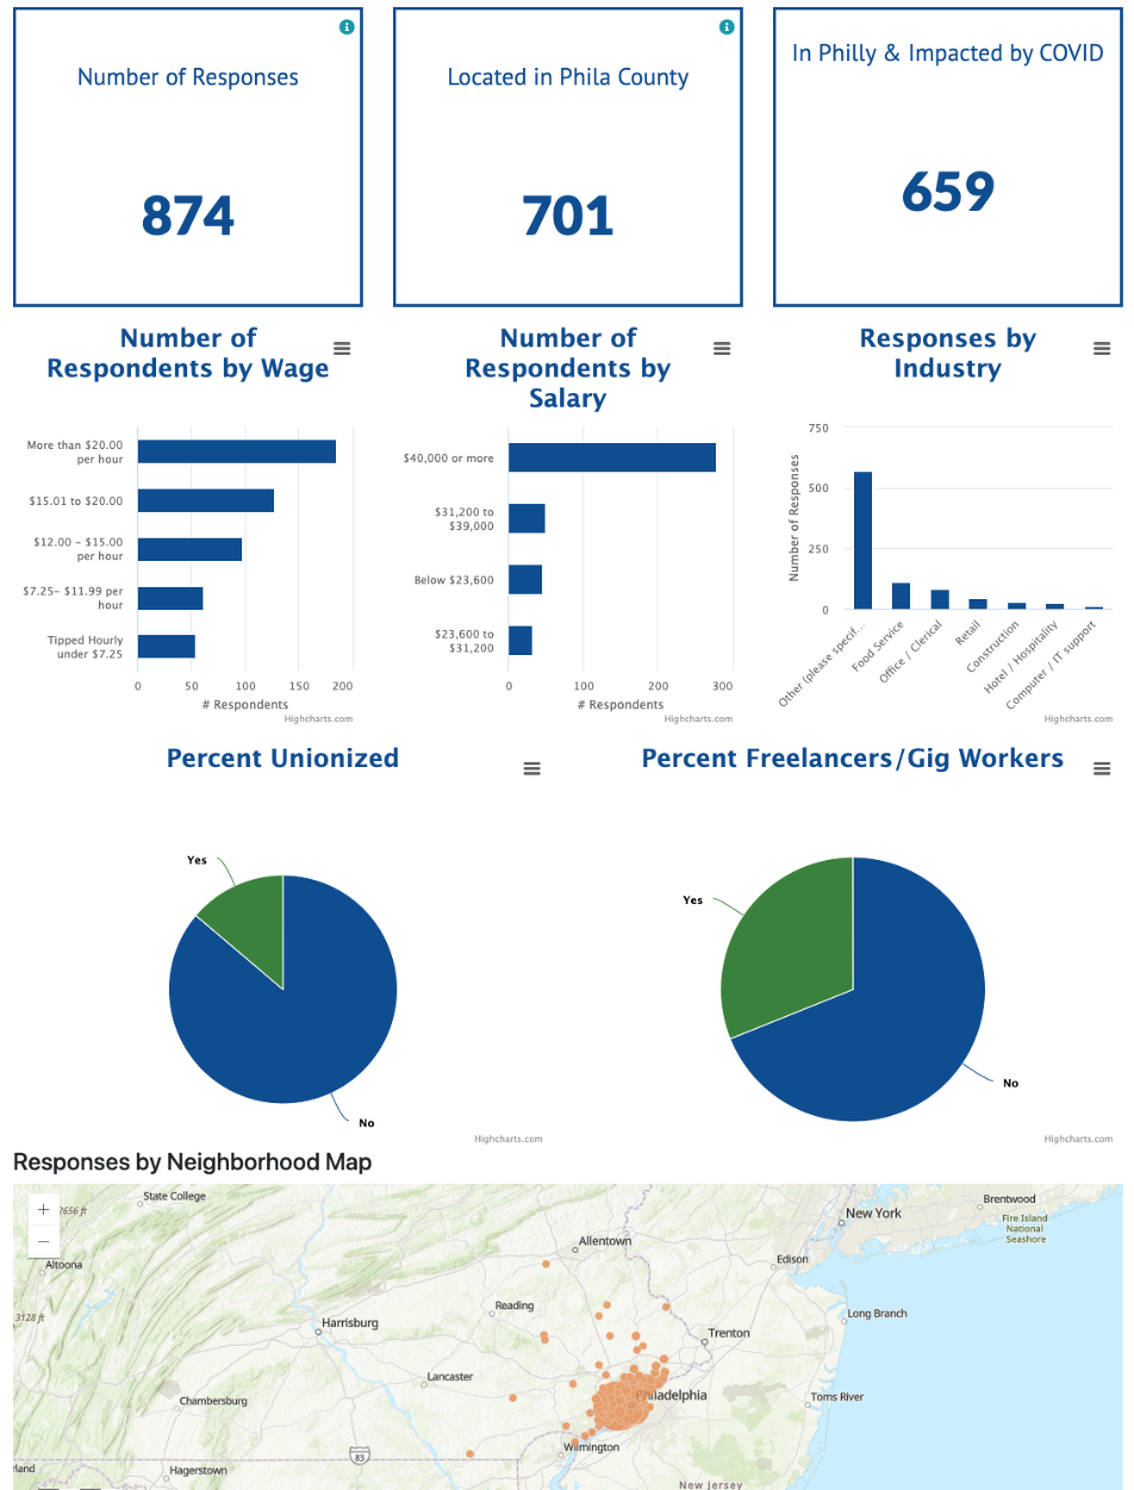
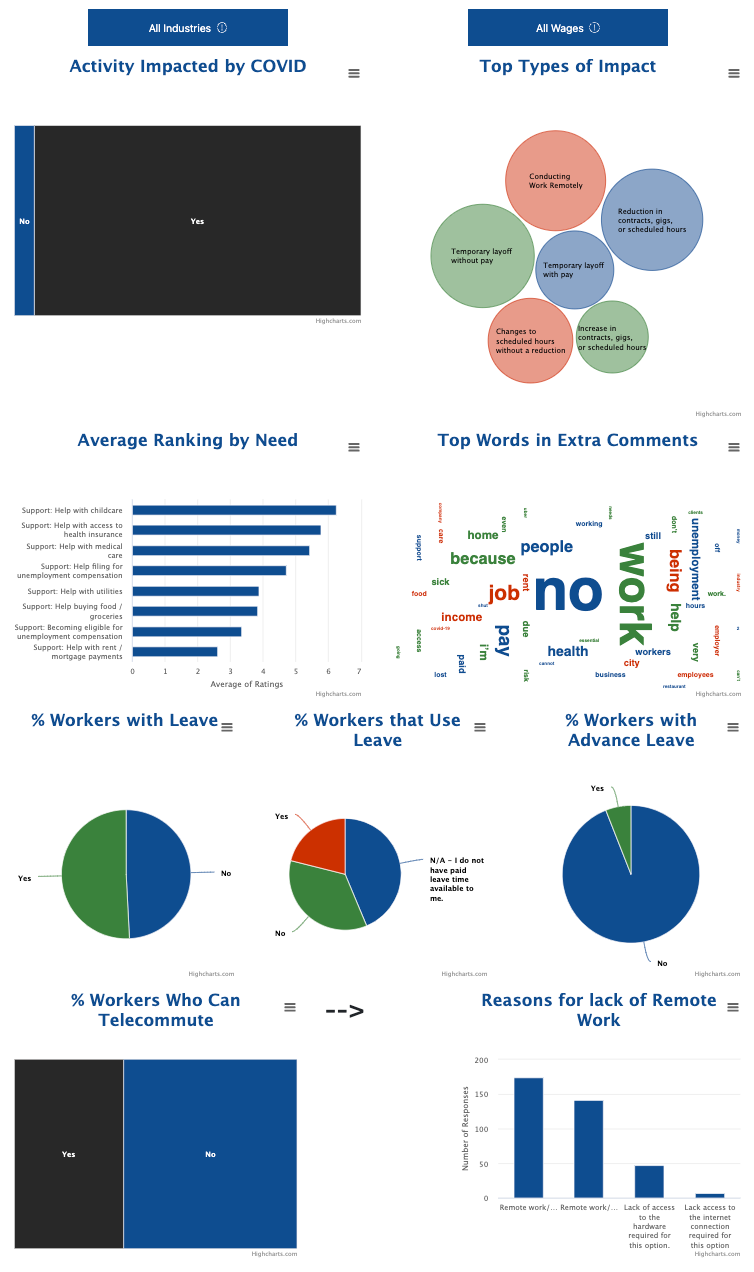
During the beginning of the pandemic, we helped a major city government analyze data from one of their COVID impact surveys. We pulled in the data, performed calculations and aggregations, and created visualizations to best show insights from the survey. The visualizations were created with JavaScript and HighCharts, and are directly part of the webpage. They are viewable on any device, anywhere in the world. The live dashboard is available to preview upon request.