Data Analytics Blog
Useful Python Snippets
October 26th, 2019 by BoxplotThe goal of this blog post is a compilation of little tidbits and code snippets that address common issues when programming for data analysis in Python. General Snippets Difference between JSON and XML This page gives a great example of the difference between data in JSON format and XML format. It shows the exact same […]
A/B Testing Example (Two Proportion Hypothesis Test)
September 25th, 2019 by BoxplotA/B testing (sometimes called split testing) is comparing two versions of a web page, email newsletter, or some other digital content to see which one performs better. A company will compare two web pages by showing the two variants (let’s call them A and B) to similar visitors at the same time. Typically, the company […]

Population Mean Hypothesis Test Example
September 25th, 2019 by BoxplotThe Situation: Kakes+, a Pennsylvania company that makes terribly unhealthy small pies/cakes, believes that their machines are overfilling their blueberry pies. Kakes+ wants to test this statistically, and has recruited you to come up with a data-backed answer. The pies should weigh 8 ounces each. Step 1: Collect Data You need to weigh the pies […]
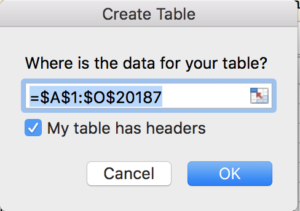
Tables & Linking Data Structures in Excel
September 1st, 2019 by BoxplotTables are one of the most important features of Excel, but are often overlooked. Tables and keeping analyses in Excel connected, will drastically increase your efficiency in Excel. Let’s start by understanding how they work with PivotTables. We’re going to use an R Dataset called DoctorContacts. Download the .csv file using this link (and save […]
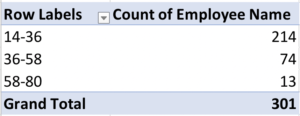
Grouping in PivotTables
September 1st, 2019 by BoxplotGrouping in PivotTables is a way of combining data to perform analyses without having to use functions. You can group numeric columns to turn them into categories, you can group date columns by date ranges to get even intervals, and you can group text columns to put together similar values. We’ll go through all three […]
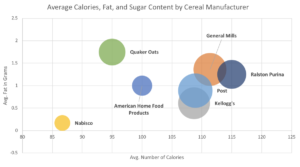
Make a Bubble Plot in Excel
September 1st, 2019 by BoxplotMost people don’t know that bubble plots even exist in Excel. In this blog post, we’ll walk through how to take advantage of these very effective charts! They are great for comparing three quantitative variables at once. For a nice intro to bubble plots, check out Hans Rosling’s very famous Ted Talk. If you don’t […]
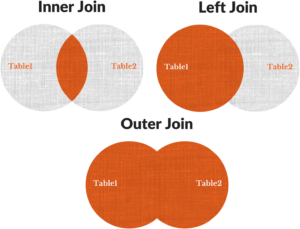
Understanding JOINs in SQL
September 1st, 2019 by BoxplotJoins in SQL Joins are one of the most important (if not THE most important) concepts in SQL. If you take the time to solidly understand how joins work, you’ll be in an excellent place for writing queries. So, let’s dive in! Join Definitions Joining tables in SQL is a way of combining them. It […]
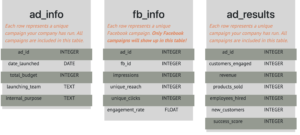
Understanding Multiple JOINs in SQL
September 1st, 2019 by BoxplotMultiple joins are one of the toughest SQL concepts – in this post we’ll decode them and review some common pitfalls. One of the best ways to learn is with an example. If you’d like to follow along, you can download this zip file that contains the three tables as .csv files here, and import […]
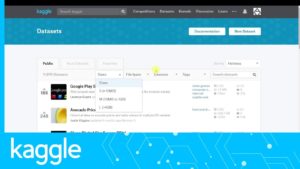
Free Datasets
September 1st, 2019 by BoxplotA list of freely available data on the web. The first list is sites we think are the best for accessing quality datasets. Below that are additional sources by category. Best Sources Kaggle By far our personal favorite! There are dozens if not hundreds of quality datasets available here. ICPSR You have to create an account, […]
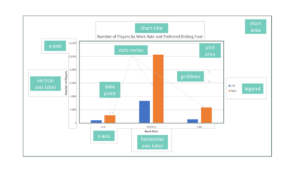
Formatting Charts in Excel
September 1st, 2019 by BoxplotFormatting charts in Excel is no easy task. It’s time-consuming, and Excel is pretty fussy which doesn’t make things easier. In this post I’ll give general tips for formatting charts, and also go over a few common scenarios. Understand the Parts of a Chart First thing’s first: it’s important to get the syntax down pat […]